Post-construction stormwater regulations continue to move away from traditional Best Management Practices (BMPs) and are shifting to Low Impact Development (LID). This transformation requires retaining stormwater onsite. Common LID tools include the reduction of impervious area with pervious pavements and porous hardscape, bioretention and underground infiltration. A new structural BMP encouraged in many LID-focused stormwater regulations is Rainwater Harvesting (RWH), because capturing and using stormwater for a beneficial purpose clearly reduces runoff from a site. Few of these new LID guidelines have detailed a method to calculate the runoff reduction the RWH system will provide. If an engineer chooses to design an RWH system with a goal of reducing runoff, they are often left to create their own calculations and models to predict the runoff reduction. This article discusses runoff reduction calculations for RWH systems and addresses common pitfalls and the essential variables required for an accurate model.
Why is RWH modeling unique?
Modeling most stormwater BMPs includes two groups of variables. This first group is the local weather and climate that can produce runoff. Typically, the state or local regulatory body already has prescribed a representative design storm to be managed and has defined all of the variables in this category. The second set of variables defines the hydrology for the project site; and the engineer of record is able to provide measurements of the site area, runoff coefficients, time of concentration and infiltration rate (and other key metrics for their BMP of choice). These variables are assumed to be constant for a given site — they don't change if the project is a school or big box development.
They also don't change between weekdays and weekends, or seasonally between summer and winter. RWH is unique because it adds a third group of variables to the mix: water demand from a completed development. Water demand can vary widely based on the scale of the development, type of development and usage applications the RWH system will supply. Since RWH is a new LID practice, few models exist that accurately take into account all three groups of variables: rainfall, site hydrology and water demand from the completed project.
Basic architecture for an RWH runoff reduction model
In simple terms, runoff reduction or onsite retention is the total amount of water captured divided by the total potential runoff from the site. For example, a one-acre rooftop in a location with 45 inches of rainfall could generate up to 1.2 million gallons of runoff. If the RWH system were to capture and use 900,000 gallons, the runoff reduction would be 75 percent. While past rainfall will not necessarily predict the future, stormwater models use historical data as a baseline for system sizing. A continuous daily rainfall model should be implemented because it provides a wide range of variation and historical daily rainfall data is relatively easy to obtain. The actual calculation follows these simple steps:
- Daily Runoff: taken from historical daily rainfall
- Daily Stormwater Captured: the portion of runoff that can fit within the available storage (the cistern could be full)
- Daily Overflow: the amount of runoff in excess of the available storage
- Daily Demand: water removed from the cistern based on weekly and seasonal demand variables
- Daily Ending Balance of the Cistern: the amount left in the cistern when the Daily Demand Volume is used.
These calculations then are performed for each day of rainfall history and summed for annual totals. Ten to twenty years of data provides a wide range of variation and intensity to understand how the system will perform under various conditions.
Supply sources
Basic supply variables consist of the impervious area, rainfall depth and a runoff coefficient. Daily rainfall data should be attained from a rain gauge as close to the project site as possible to ensure representative rainfall data is fed into the model. At this point, it can be very useful to graph the daily rainfall data for a few years. This will provide information about the seasonality, frequency and intensity of rainfall in your project area. You then can begin to estimate what size of cistern and demand sources are necessary to make RWH feasible. Many projects can collect runoff from various surfaces – conventional rooftop, green roof, patios and even parking lots – so it is important to provide an appropriate coefficient for each type of collection surface. At this point, it is simple math to calculate amount of water available for capture during the entire modeling period.
If the primary goal is water savings instead of runoff reduction, additional sources of water can be added to the system. Common sources include HVAC condensation and greywater. These may trigger different treatment requirements, but can add a significant amount of water savings for many projects.
Figure 1: Potential Daily Demand for a Commercial Office Building: Four Floors, 174,000 square feet
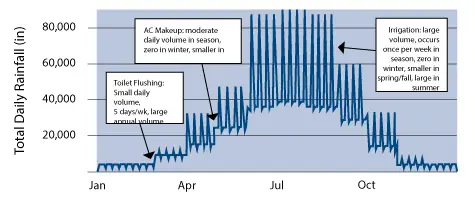
Estimating demand
In order for RWH to reduce runoff significantly, there must be sufficient demand for the captured runoff. Most water demand is for non-potable applications, such as irrigation and toilet flushing, so the additional treatment required to provide drinking water is rarely practical. Engineers should focus their design around the most common non-potable water uses: irrigation, toilet flushing, air conditioning, makeup and wash water. It is critical to develop an annual demand pattern, which takes into account the volume, frequency, timing and seasonality of the demand. These patterns vary by the project type: schools may have lower summer demand; office buildings often have lower weekend versus workweek demand; commercial and recreational facilities may have greater weekend demand.
To provide meaningful results, you should build an annual water budget for each potential water use to estimate demand for each day of the year. This way you can build weekly and seasonal variation into your total water demand to accurately reflect how the system will be used once in operation.
Irrigation – The most common application for RWH is irrigation, which can consume large volumes of water. The best source of information for irrigation demand is the landscape architect for the project. Without this information, place holder assumptions can be used; however, since irrigation demand varies widely by geography, site-specific input is best.
For example, rainfall in Wilmington, N.C., is spread throughout the year; so, irrigation offsets heavy rainfall, and rainwater can supply toilet flushing. However, in Southern California, most of the annual rainfall occurs in the early spring, so irrigation alone may not offer significant runoff reduction.
In order to recover cistern volume between storms, irrigation can be applied in excess of the agronomic demand rate of the landscape as long as the infiltration capacity of the soil is not exceeded.
While irrigation consumes large amounts of water, demand is typically seasonal and inherently higher when rainfall is lower. Despite the offset between rainfall timing and irrigation demand, irrigation commonly can provide 30 to 50 percent runoff reduction for commercial rooftops. For increased runoff reduction, engineers should consider other types of demand applications.
Toilet flushing – Toilet flushing is a very useful application for captured rainwater. Demand is year round, consistent and of significant volume for most facilities. The steady demand can offset large amounts of runoff, especially in areas where rainfall is well distributed throughout the year. Higher occupancy buildings can often offset the majority of runoff. The mechanical engineer for the project will size the plumbing system and should have an estimate for toilet flushing demand.
HVAC makeup – Cooling makeup water can be one of the largest water demands for commercial and institutional buildings. Unlike residential air conditioners that only use air, commercial systems use evaporative cooling to remove heat and this evaporation must be replaced. In addition, the cooling water tank becomes more concentrated with minerals which are left behind when the water is evaporated. These deposits may affect the performance and life of the AC systems, so these water tanks must be drained and refilled frequently.
A starting estimate for HVAC water usage between evaporation and draining concentrated water is 2.4 gallons per hour per one ton of cooling. To put this in perspective, it is common for single-family residential AC systems to be three tons. A moderately-sized office building can require 500 tons of cooling, which would use 20 gallons of water per minute when operating. This type of water usage adds up quickly. Climate, occupancy pattern and building type are just some of the variables that affect HVAC water demand. Either by estimates or calculations from the mechanical engineer, the daily water usage from the HVAC should be added to water budget. (see Figure 1)
Wash water and process water – A top water user in residential applications is clothes washing. RWH can be a good fit to supply wash water for apartments, dorms and other facilities with shared-laundry facilities because the demand is concentrated in one location. Many light industrial buildings use water for cleaning or processing and RWH can be used to supply many of these applications. These types of applications should be considered and added to the water demand budget.
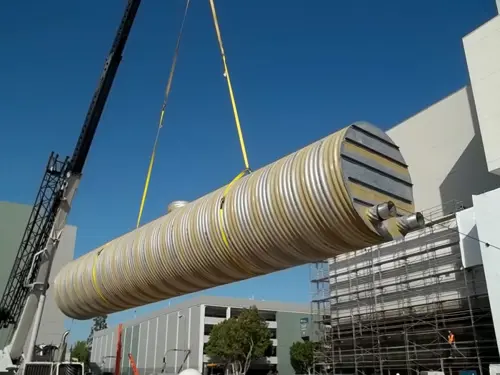
This 48-foot, 96-inch-diameter metal cistern was one of two installed in just one day at a project site in urban Los Angeles as part of a rainwater harvesting treatment and detention system.
Calculating results and optimizing the system
Once the daily supply data is calculated and the water demand budget has been created, the final step is to input a cistern size and calculate overflow and runoff. The daily calculation includes the same steps listed previously:
- Runoff is added to the cistern at the beginning of each day
- Any overflow from the cistern is recorded
- Demand is withdrawn from the cistern
- The ending balance in the cistern determines the available storage at the beginning of the next day.
This method allows you to total all runoff, the amount of runoff captured, total water used and the amount of water provided from the cistern on an annual basis. During 10 or 20 years of simulations, you can predict the average expected performance of your system, in addition to understanding what happens during wet and dry years.
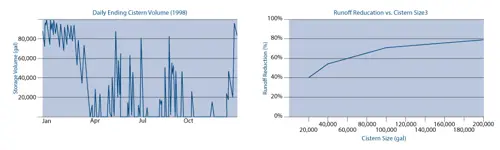
To improve runoff reduction and water savings, a common impulse is to increase the cistern size. While this will offer improvements, there are diminishing returns to increasing the cistern size. Adding year-round demand applications usually provides a more substantial improvement to the runoff reduction than increasing cistern size, as shown in Figures 2 and 3.
Figure 2: Increasing cistern size often provides diminishing returns for runoff reduction and water savings.
Figure 3: When water supply and demand are well balanced, the cistern fills and drains frequently, the cistern rarely overflows and a high level of runoff reduction can be achieved.
Modeling first flush diversion and managing a design storm
Many building codes still recommend first flush diversion, which funnels the first portion of each rainfall event away from the cistern in an attempt to keep pollutants out of the cistern. This practice is well intended, but is counter-productive to runoff reduction goals because it allows runoff. As shown on page 5 in Table 1, a conservative estimate of 9 percent to 16 percent of the annual runoff based on daily total rainfall would come from the first 0.05 inch of rainfall in the cities listed. In reality, passive first flush diversion happens each and every time it begins to rain. So runoff is diverted in the afternoon, even if it rained in the morning. From a runoff reduction standpoint, first flush diversion should not be used and adequate pretreatment should be implemented instead.
Your local jurisdiction only may require you to manage a water quality storm depth, such as one inch, not the total daily rainfall. You can incorporate this variable to weed out the rare peak events and allow you to optimize the RWH design to meet the specific regulatory requirement, similar to the design of other BMPs. Water quality depths vary by locality and are sized to capture the majority of the annual rainfall. Table 1 below is based on a common design storm depth of one inch.
You can include both first flush diversion and a water quality depth in your model by dividing the daily rainfall into three components:
- Runoff up to the first flush depth
- Runoff in your target zone between the first flush depth and the design storm (this can be a range)
- Peak runoff greater than the design storm depth.
Runoff and water captured for each portion of the daily rainfall may be tracked and calculated.
Common modeling pitfalls
Your approach should offer a conservative estimate for runoff reduction and is proven to be a valuable tool in optimizing and designing an RWH system. Overall, this type of model is relatively simple and forgiving, because small mistakes don't tend to significantly affect the overall runoff reduction result. There are, however, several pitfalls engineers may encounter when developing or using a model. The three most common are discussed next.
Zero gallon cistern error – Two years ago, when trying to estimate runoff reduction before adding an RWH system to a manufacturing facility, it seemed even a small cistern could have significant runoff reduction. While looking at one early model, the cistern size was shrunk until a zero gallon cistern was entered, and still yielded a 20 percent runoff reduction. With this, it was obvious there was a serious error from simply taking the daily runoff, subtracting daily usage, then filling the cistern with the difference. This method assumed rainwater was usable the instant it exited the downspout – regardless of whether the manufacturing facility needed water at that point in time or not. This mistake was a common error, and models may still be found that predict water savings and runoff reduction for zero gallon cisterns.
Monthly data vs. daily data – For small residential systems, monthly data can be sufficient to understand how supply and demand balance and offer guidance on cistern sizing. To meet stormwater goals and calculate runoff reduction, this data is too coarse and assumes the timing for demand and supply coincide. The intensity, frequency and variation of the rainfall are obscured and this method could grossly overestimate the amount of benefit an RWH system will provide.
Local rainfall data – We all know weather varies geographically and microclimates exist. In reality, this effect can be dramatic. For example, Portland, Oregon, receives approximately 40 inches of annual rainfall. However, Portland's water supply comes from nearby Mt. Hood, which receives more than 150 inches of annual rainfall. While engineers may be tempted to obtain data from the nearest airport because it is readily available, and some models only have rain data from a handful of locations, engineers are cautioned to always try to obtain rain data from a source very close to the project location to prevent a major error in their projections.
Table 1: Geographic Rainfall Variation — Daily Rainfall Totals in Select Cities (in inches)
| Annual Rainfall |
Portland OR |
Long Beach CA |
Wilmington NC |
| |
Average |
21 YR |
Total |
Average |
21 YR |
Total |
Average |
21 YR |
Total |
| First Flush: 0.05" |
6.8 |
142 |
16% |
1.4 |
30 |
11% |
5.1 |
108 |
9% |
| Design Storm: 0.05" - 1" |
33.1 |
696 |
78% |
9.1 |
191 |
73% |
36.8 |
773 |
64% |
| Peak Events: >1" |
2.6 |
54 |
6% |
1.9 |
40 |
15% |
15.8 |
331 |
27% |
| Total |
42.5 |
892 |
|
12.4 |
261 |
|
57.7 |
1212 |
|
Comparison of available models
Any engineer is fully capable of developing his or her own model to suit the specific project needs. There are also a variety of free, public-use models. For example, Washington Department of Ecology, Virginia Department of Conservation and Recreation (DCR), North Carolina State University and Contech Engineered Solutions all have accessible models (see Table 2). We recommend users try these models to understand different approaches and provide them with a head start before developing their own design tool for an upcoming project.
Table 2: Comparison of Models
| Model |
Primary Goal |
Model Type |
Rain Data |
Supply Options |
Demand Options |
Output |
Zero Gallon Cistern |
| North Carolina State University |
General RWH |
Daily |
18 gagues
3 states |
Roof,
2nd Sources |
Irrigation,
Toilet Flushing,
Wash/Process,
Wash/Process,
Custom Input |
Irrigation,
Toilet Flushing,
Wash/Process,
Wash/Process,
Custom Input |
0% Runoff Reduction |
| Virgina Department of Conservation and Recreation |
Stormwater Runoff Reduction |
Daily |
4 gauges
1 state |
Roof |
Irrigation,
Toilet Flushing,
Laundry,
Wash/Process |
Irrigation,
Toilet Flushing,
Laundry,
Wash/Process |
11% Runoff Reduction Credit |
| Washington Department of Ecology |
Water Conservation |
Monthly |
29 gauges
1 state |
Roof |
Irrigation,
Indoor Usage |
Irrigation,
Indoor Usage |
28% Water SavingsModel |
Greg Kowalsky, BSME,is the Low Impact Development product manager for Contech Engineered Solutions and an active member of the American Rainwater Catchment Systems Association (ARCSA). He has six years of experience in stormwater design and 15 years of engineering experience.
Kathryn Thomason, P.E,is a senior design engineer with Contech Engineered Solutions and currently specializes in rainwater harvesting, stormwater treatment and detention design. She is an active member of the American Rainwater Catchment Systems Association (ARCSA) and has six years of engineering experience in stormwater design.
REFERENCES
- Contech Engineered Solutions: UrbanGreen Rainwater Harvesting Runoff Reduction Calculator, 2012. www.conteches.com/Design-Toolbox/DYO-project.aspx
- Georgia Rainwater Harvesting Guidelines: In accordance with Appendix I 'Rainwater Recycling Systems' of the 2009 Georgia Amendments to the 2006 International Plumbing Code, 2009.
- Guidelines on Rainwater Catchment Systems for Hawaii, Patricia S.H. Macomber, College of Tropical Agriculture and Human Resources, University of Hawaii at Manoa, Revised Edition 2010.
- NCDC (National Climatic Data Center) Cooperative Station Data, DS3200 Summary of the Day Data Set for Years 1850s to 2001.
- North Carolina State University: Rainwater Harvesting Model, 2012. www.bae.ncsu.edu/topic/waterharvesting/model.html
- Oregon Smart Guide: Rainwater Harvesting, Department of Consumer & Business Services Building Codes Division, Oregon, 2010.
- "PBMP – Cooling Systems," California Urban Water Conservation Council (CUWCC) Potential Best Management Practices (PBMP) Report – Commercial-Industrial Cooling, Koeller and Company, James Riesenberger with the Alliance for Water Efficiency, 2006.
- "Reducing Water Costs in Building HVAC Systems", Facilities Engineering Journal, Dan Weimar and Allan Browning, May/June 2010.
- Technical Guidance: Stormwater Treatment Credit for Rainwater Harvesting Systems, North Carolina Division of Water Quality, Revised September 22, 2008. www.ncwaterquality.org
- The Engineering ToolBox: Cooling Load Calculators, 2012 www.engineeringtoolbox.com/cooling-loads-d_665.html
- The Texas Manual on Rainwater Harvesting, Texas Water Development Board, Third Edition 2005.
- Virginia Rainwater Harvesting Manual, Adrienne LaBranche, Hans-Otto Wack, Ph.D., David Crawford, Ed Crawford, Nickolas J. Sojka, DVM and Cabell Brand, compiled by The Cabell Brand Center, August 2007.
- Virginia DCR (Department of Conservation and Recreation) Stormwater Design Specification No. 6, Rainwater Harvesting, Version 1.9.5, March 1, 2011.
- Virginia DCR: Stormwater Runoff Reduction Model, March 2011. www.dcr.virginia.gov/lr2f.shtml
- Washington Department of Ecology: Rainwater Harvesting Calculator, 2012. www.ecy.wa.gov/programs/wr/hq/rwh.html

